Author
Arda Bener Çağlayan
Abstract
Netflix Inc. is among the digital media industry leaders with over 160 million users and estimated revenue of $20 billion. Netflix has been revolutionising the industry with the help of Reed Hastings, CEO, whose digital marketing approach is centred around data, analytics, technology, and customers. Hastings' investments in programming and technology have enabled Netflix to collect and analyse user data as a means to enhance user experience. Through the application of data insights, Netflix offers its customers highly personalised experiences, which foster customer engagement and satisfaction. Meanwhile, Hasting’s social media strategy, which focuses on entertainment, uses social media channels to engage in conversations and build relationships with customers. A content development strategy deduced from digital marketing metrics allows Netflix to make informed decisions to attract target audience groups. Therefore, Hastings' innovative digital marketing tools has contributed to the firm’s current market leader position and results in attracting more customers.
Introduction
Founded in 1998 in California by Reed Hastings, Netflix Inc. is a media-services provider and production company. Since its founding in the late 1990s, Netflix has been revolutionising the way people stream as well as reforming the digital marketing norms (Walker et al, 2017). With an estimated annual revenue of $20.15 billion, Netflix is one of the 21st-century media industry leaders whose growing popularity has evolved from its data-driven and customer-centric digital marketing approach (Watson, 2020).
Prior to the development of digital streaming technologies, the media-services companies were operating through a DVD-based model. With technological advancements, tech firms started allowing consumers to stream content online, threatening Netflix’s DVD-based business. As a result, Hastings responded to the challenge by turning Netflix into a web-based streaming service. This transition, however, was not sufficient as the number of web-based streaming services was increasing (Oster, 2012). Hastings decided to reframe the firm’s digital marketing strategy by taking a data-driven and customer-centric approach. Netflix’s utilisation of data collection, marketing metrics, and algorithms have provided its customers with more personalised experiences. While professionally engineering its technology and programming, Netflix has also centred its social media strategy around engagement, interactivity, entertainment, and building relationships.
Even though Netflix has managed to gain a competitive edge and remarkable market share with its novel approach, the growing digital media market still poses serious challenges for Hastings (Rataul, 2018). As innovative digital marketing strategies are redefining the industry competition, a series of questions needs to be answered for a greater understanding of Netflix’s state-of-the-art digital marketing strategies: How does Hastings manage to maintain its current market position? What are some of the digital marketing tools Netflix makes effective use of?
The Netflix Model: Customer-Centric & Data-Driven
Fernández-Manzano et al. (2016) suggest that “the distribution industry is aware that its competitive advantage comes from obtaining information from its own users”. Over the years, Hastings’ approach that puts customers at the forefront of its business objectives has realigned the firm’s focus on enhancing customer experience (Venkatraman, 2017). Thus, Hastings recognised the value of user data and analytics as a marketing making tool based on ample data, creating Netflix’s data-driven digital marketing strategy.
Hastings notably invests in technology and digital marketing areas, including artificial intelligence, big data systems, data scrapping tools, and advanced analytics such as proprietary data mining techniques and algorithms. Hastings has invested $1.3 billion in technology and development in 2018 and plans to spend $1 billion on its marketing in 2019 (Netflix Investor, 2020) (Netflix Inc, 2019). Such investments enabled Netflix to gather and process user data to churn out meaningful information to leverage information on consumer behaviour and preferences. For instance, the Netflix analytics system runs 250 A/B tests per year and collects data on various aspects of user behaviour, such as when a user hits play/pause or stops watching a title halfway through; when a user clicks on the + button to add a TV show to their Watchlist (Dans, 2020). The system harvests information from each user, adding up to a total of 300 million member profiles (Bullocks, 2018).
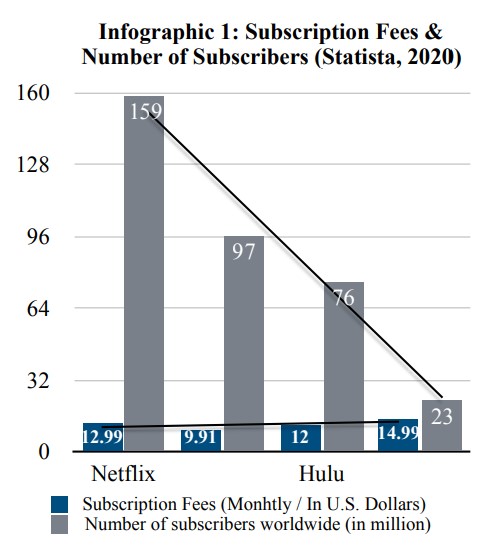
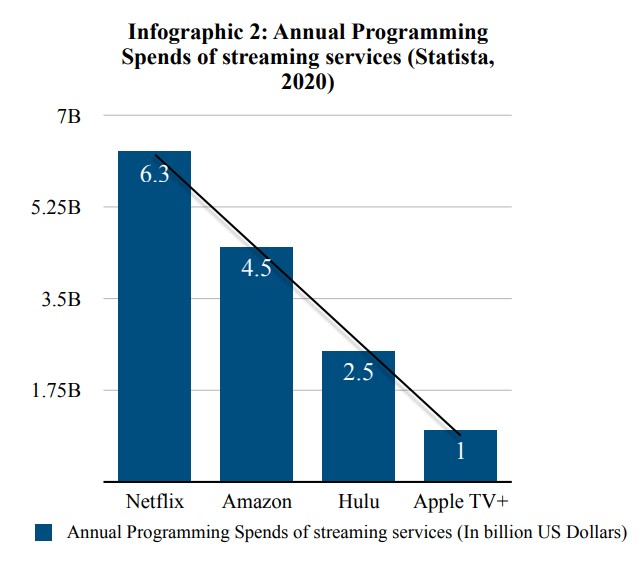
Infographic 1 demonstrates that Netflix’s monthly subscription fee ($12.99) is well within the market average compared to Netflix’s biggest competitors. The highest fee belongs to HBO with $14.99 and the lowest to Amazon Prime Video ($9.91). Additionally, Infographic 1 shows that Netflix has the highest number of subscribers worldwide (~160M). Hence, there is no significant correlation between pricing and number of subscribers according to Infographic 1. However, Infographic 2 hints upon a directly proportional relationship between the programming spends and the number of subscribers. Hastings’ investments in programming and data technologies have enabled Netflix to satisfy the customers’ needs and expectations by accurately deducing from its immense amount of data. Meanwhile, Apple TV+’s lack of programming spends ($1 billion), compared to other firms, might be a reason that Apple TV+ is losing its subscribers in 2020 ((Vlastelica, 2020). Therefore, Hasting's data-driven digital marketing approach has helped the firm attract new subscribers and become a more preferable service, resulting in the firm’s current leader position in the fast-moving market (Natalie, 2017). So, what does Netflix do with the conclusions about user behaviour drawn from data?
Netflix’s Personalisation Effect & Recommendation System
Among many digital marketing tools on which Netflix heavily depends, personalisation is one of the pillars of Hasting’s data-driven digital marketing strategy. A consumer research study suggests that a typical web-based streaming service user loses interest after 60 - 90 seconds of selecting, having reviewed 10 to 20 titles on one or two screens (Gomez-Uribe and Hunt, 2015). If a user cannot find something they are interested in, the risk of the user abandoning the site increases substantially. Netflix’s data-driven personalisation tools, such as AI algorithms, effectively guide Infographic 1: Subscription Fees & Number of Subscribers (Statista, 2020) 0 32 64 96 128 160 Netflix Hulu 23 76 97 159 12.99 9.91 12 14.99 Subscription Fees (Monhtly / In U.S. Dollars) Number of subscribers worldwide (in million) Infographic 2: Annual Programming Spends of streaming services (Statista, 2020) 1.75B 3.5B 5.25B 7B Netflix Amazon Hulu Apple TV+ 1 2.5 4.5 6.3 Annual Programming Spends of streaming services (In billion US Dollars) customers to find the best options for them when streaming among the platform’s diverse pool of content (Gomez-Uribe and Hunt, 2015). Therefore, the application of data insights allows Netflix to offer customised journeys and personalised suggestions, which draw its users deeper into the platform, fosters customer engagement rates, and attracts new customers (Bleier et al, 2018).
A well-known personalisation tool Netflix uses is the Recommendation Engine. This is an algorithmic tool that recommends different content to each user based on their previous streaming choices. According to the McKinsey report, Netflix’s personalised recommendation engine influences over 80 percent of content hours streamed on its platform, providing each customer with a different experience (Henke et al, 2016). Moreover, Artwork Personalisation is another digital marketing tool proposed by Hastings that identifies the best artwork or imagery and displays it for each user with an AI algorithm (Medium, 2017). Its purpose is to highlight the aspects of a title that are specifically relevant to each user and to catch their attention (Netflix Research, 2020).
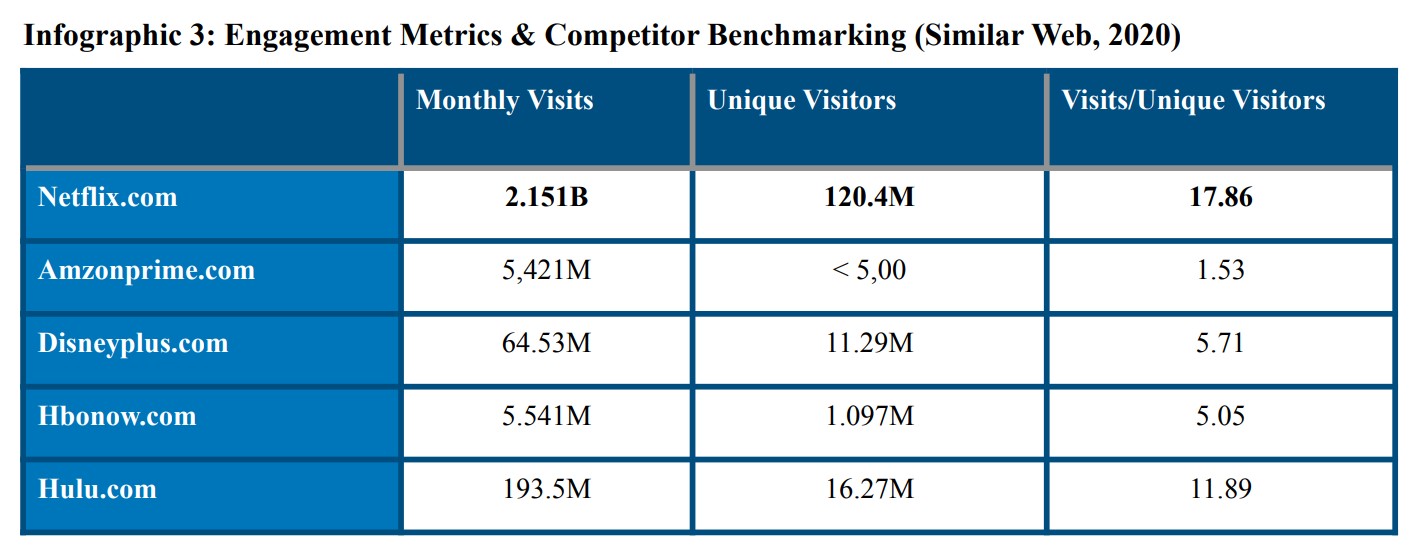
With the powerful use of such tools, users stay more focused and interested, making them spend more time on the platform. Infographic 3 shows that with 2.151B monthly visits and 120.4M unique visitors, netflix.com has the highest monthly visit number among its 5 biggest competitors. With the help of its more effective and accurate personalisation tools relative to its competitors, Netflix is attracting significantly more users in terms of both engagement metrics and subscriber numbers. When users enter the platform, their experiences are personalised across multiple dimensions, including the suggested videos and their ranking rows shown in the homepage, the titles of those rows, the galleries displayed, the in-app messages they receive and more (Netflix Research, 2020). In the marketing mix, this is known as segmentation and as the marketing metrics for Netflix in Infographic 3 illustrates high visitor statistics, Netflix makes the most of it (Egan, 2018). Therefore, this argument hints upon a positive correlation between Netflix's effective personalisation and customer attraction/satisfaction.
Netflix Approach to Social Media
As opposed to industry-wide social media marketing approaches, Hasting's approach to social media is centred around creativity, interactive engagement, authenticity and entertainment. With 57M followers on Facebook, 22M on Instagram and 7.8M on twitter, Netflix has a strong presence on social media and a growing global fan-base (Ramakrishnan, 2019).
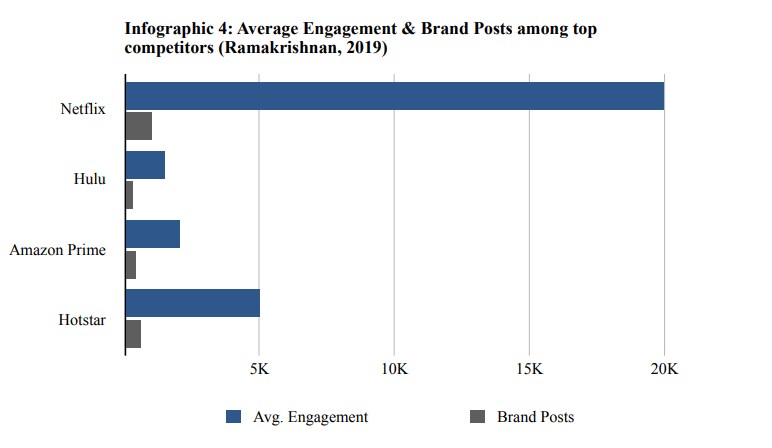
One of Hasting’s unique social media strategies is that the firm aligns its purpose of existence - entertainment - with their social media content, which is often characterised with humour and wit. According to the Institute for Operations Research, social media posts with entertaining and humorous content is positively associated with higher engagement rates (Lee et al, 2018). Infographic 4 demonstrates that Netflix has the highest number of brand posts (1K+) and the highest engagement rates (20K) compared to its top 4 rivals. Although Netflix's number of brand posts does not diverge greatly from its competitors', its engagement rate is clearly ahead of the competition. Based on Infographic 4, it can be concluded that the average engagement rate is highly dependent on the content of the social media post rather the number of brand posts. Therefore, it is not surprising that Netflix’s immense popularity on social media results from its entertaining and humorous social media content.
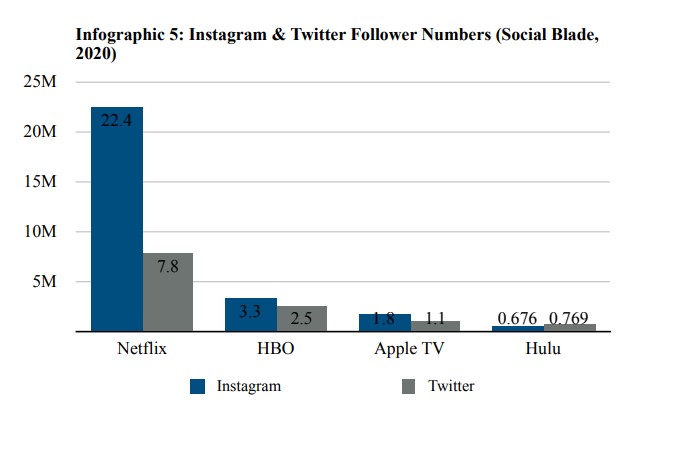
On the other hand, Infographic 5 shows that Netflix has 10 times more followers than Hulu and 3 times more followers than HBO on Twitter. Netflix's greater number of followers can be associated with its distinctive social media marketing. Postnikova and Nilsson (2019) states, “Research implies there is a relationship between customers emotional response, defined as pleasing or arousing, to brand’s marketing message and interacting behaviours, measured through liking and commenting”. Hastings' strategy uses social media channels not only to distribute content and address customer service queries but also to engage in conversations and build relationships with the audience. For instance, Netflix is known for its prompt humorous responses and “memes” on its Twitter account. Hence, Netflix's high engagement statistics and rapidly growing follower number are outcomes of Hastings' unique digital marketing strategy on social media.
Furthermore, Netflix uses social media as an analytics tool by creating surveys about its content and asking for ideas about whether the firm should produce another season of a specific title. Netflix’s digital marketing team also takes the content reviews/opinion posts into critical consideration to gather information beyond just analysing user behaviour and data. As Ryan (2014) suggests, “All advertisers need a lot more content so that they can keep the engagement with consumers fresh and relevant, because of the 24/7 connectivity”. Thus, Hastings' marketing strategy is highly dynamic, making the firm keen on discovering what users like to see more and/or less on the platform.
Digital Marketing Metrics: Traffic Share & Strategic Content Development
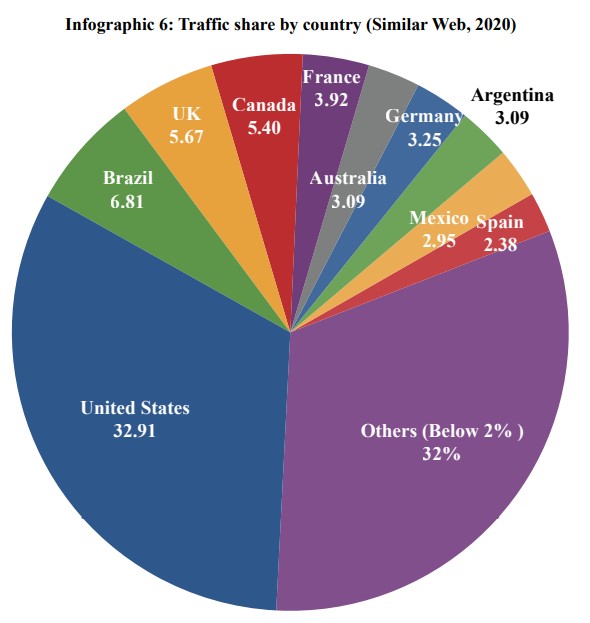
Infographic 6 shows the percentage of traffic sent to the website by each country. The majority of traffic is coming from the US (32.91%), then from Brazil, UK, and Canada. Being both a producer and a provider, Netflix uses these traffic metrics in its strategic content development by Infographic 5: Instagram & Twitter Follower Numbers (Social Blade, 2020) 5M 10M 15M 20M 25M Netflix HBO Apple TV Hulu 2.5 1.1 0.769 7.8 1.8 0.676 3.3 22.4 Instagram Twitter Infographic 4: Average Engagement & Brand Posts among top competitors (Ramakrishnan, 2019) Netflix Hulu Amazon Prime Hotstar 5K 10K 15K 20K Avg. Engagement Brand Posts analysing user behaviour and understanding why, how, from where and when users engage with the platform. For example, Brazil (6.62%) has the second-highest traffic share according to Infographic 6. Based on the traffic metrics, Hastings' team acknowledged the platform’s rapidly growing Brazilian audience, and the firm released its first Brazilian original series, named 3%. With the help of Hastings' content development strategy, the TV show became one of the most-watched original series in Brazil and Latin America. Moreover, in 2016, 71% of streaming services users in Brazil preferred to stream on Netflix, which is only 13 points behind YouTube. Given that YouTube is a free service, such statistics are remarkable (Siebert, 2017). According to an independent research study, Netflix numbers were even higher than Globo, the biggest media group in Brazil (Emarketer, 2016). Thus, Netflix managed to gain more popularity in Brazil media market by making effective use of traffic metrics.
Implications of Hastings’ User Data Dependant Marketing
The implications of data-driven digital marketing strategy used by streaming services, such as Netflix, Apple, and Youtube, includes the increased risk of data violation, business ethics problems, legal barricades regarding the protection of data privacy, and negative public opinion on personal data collection. According to Murgia's article (2019) in Financial Times, Netflix was found to have been violating the EU General Data Protection Regulation by not disclosing the required information to users and subject to be fined a theoretical maximum of $21.4 billion or 4 percent of the companies’ worldwide turnover (Meyer, 2019).
Questions
1) As the number of streaming services is on increase and the competition is fierce, what role Hastings' digital marketing strategy plays in the firm's market leader position?
2) Is there a way for Netflix to leverage its data insights to continue to innovate beyond?
3) What are the implications of Hastings’ digital marketing strategy? What changes can be suggested to Hastings to minimise the effects of negative implications?
4) What differentiates Netflix to stand up to competition from more seasoned players in the digital media market?
Reference List
Bleier, A., De Keyser, A. and Verleye, K., 2018. Customer engagement through personalization and customization. In Customer engagement marketing (pp. 75-94). Palgrave Macmillan, Cham.
Bullock, L., 2018. 5 Brands Taking Personalized Marketing To The Next Level. [online] Forbes.
Dans, E., 2020. Netflix: Big Data And Playing A Long Game Is Proving A Winning Strategy. [online] Forbes. Available at: <https://www.forbes.com/sites/enriquedans/2020/01/15/ netflix-big-data-and-playing-a-long-game-is-proving-a-winningstrategy/#72e82055766e>.
Egan, S., 2018. Council Post: Netflix Is Winning At Email Marketing. [online] Forbes. Available at:
Emarketer. 2016. Youtube, Netflix Find Massive VOD Success In Brazil. [online] Available at:
Fernández-Manzano, E.P., Neira, E. and Clares-Gavilán, J., 2016. Data management in audiovisual business: Netflix as a case study. El profesional de la información (EPI), 25(4), pp.568-576.
Gomez-Uribe, C.A. and Hunt, N., 2015. The netflix recommender system: Algorithms, business value, and innovation. ACM Transactions on Management Information Systems (TMIS), 6(4), pp.1-19.
Henke, N., Bughin, J., Chui, M., Manyika, J., Saleh, T., Wiseman, B. and Sethupathy, G., 2016. The age of analytics: Competing in a data-driven world. McKinsey Global Institute, 4.
Lee, D., Hosanagar, K. and Nair, H.S., 2018. Advertising content and consumer engagement on social media: Evidence from Facebook. Management Science, 64(11), pp.5105-5131.
Medium. 2017. Artwork Personalization At Netflix. [online] Available at: <https:// netflixtechblog.com/artwork-personalization-c589f074ad76>.
Meyer, D., 2019. Apple, Netflix And Youtube Among Streamers Flouting EU Privacy Law, Say New Complaints. [online] Fortune. Available at: <https://fortune.com/2019/01/18/apple-netflix- youtube-gdpr/>.
Natalie, 2017. Netflix: A Personalized Viewing Experience. [online] Digital Innovation and Transformation. Available at: <https://digital.hbs.edu/platform-digit/submission/netflix-a- personalized-viewing-experience/>.
Netflix Research. 2020. Personalization & Search. [online] Available at: <https:// research.netflix.com/business-area/personalization-and-search>.
Oster, S.M., Keith Chen, M. and Rosenthal, J.W., 2012. Netflix and Qwikster: Would Success in DVDs Lead to Success in Streaming?. Yale School of Management: SAGE Business Cases
Postnikova, A. and Nilsson, M., 2019. Stop being so informative!: A quantitative study on social media content and consumer engagement.
Ramakrishnan, V., 2019. How Netflix's Social Media Strategy Dominates The Online Streaming Industry. [online] Unmetric Social Media Analytics. Available at: <https:// blog.unmetric.com/netflix-social-media-strategy>.
Rataul, P., Tisch, D.G. and Zámborský, P., 2018. Netflix: Dynamic capabilities for global success.
SAGE Publications: SAGE Business Cases Originals.
Ryan, D., 2014. Understanding Digital Marketing: Marketing strategies for engaging The Digital Generation. United Kingdom: Koganpage.
Social Blade. 2020. Social Blade: Netflix. [online] Available at: <https://socialblade.com/twitter/ user/netflix>.
SimilarWeb. 2020. SimilarWeb Netflix. [online] Available at: <https://pro.similarweb.com/#/ website/audience-geography/netflix.com/*/999/3m>.
Statista. 2020. Topic: Netflix. [online] Available at: <https://www.statista.com/topics/842/ netflix/> . Venkatraman, V., 2017. Netflix: A Case Of Transformation For The Digital Future. [online]
Vlastelica, R., 2020. Apple’S Push Into TV Is ‘Failing To Resonate,’ Analyst Says. [online] Fortune.
Available at: <https://fortune.com/2020/02/03/apple-tv-plus-subscribers/>.
Walker, R., Jeffery, M., So, L., Sriram, S., Nathanson, J., Ferreira, J. and Feldmeier, J., 2017. Netflix leading with data: The emergence of data-driven video. Sage Business, Kellogg School of Management Cases: SAGE Business Cases